A season without bats
What if we played the entire baseball season without anyone taking a single swing?
"Put your sword back in its place," Jesus said to him, "for all who draw the sword will die by the sword.”
– Matthew 26:52
Albert Belle refused to take his base.
In the 11th inning of a tie game against the Angels in 1999, Belle, who’d already hit three home runs that day, got hit on the hand by a high tailing fastball. Rather than walking to first, Belle stayed in the box, demanding another pitch while barely denying he’d been hit. To Belle, taking the base wasn’t worth giving up the bat.
Five years later, Barry Bonds showed us all just how devastating that bat could be. In 2004, Bonds posted a stat line on the edge of comprehension: .362 average, .609 on-base percentage (OBP), .812 slugging, 232 walks, 45 home runs—and only 41 strikeouts. If there was ever a season to justify Belle’s protest, this was it.
Sportswriter Jon Bois saw something different. Considering the same season, he posed a seemingly absurd question: What if Barry Bonds only did what Belle refused to do? What if he played the entire year without a bat?
Suppose, Bois wondered, that every time a pitcher takes the mound against Bonds, they are so blinded by their terror of the man in the box that they fail to notice he left his bat in the dugout. And suppose that same terror induces in them a selective amnesia, causing them to forget that Bonds hasn’t taken a single swing all season. All they see is the awful fate that awaits them if their next pitch catches too much of the plate. And so, despite Bonds being as helpless as Billy Hamilton on a 91 mph fastball down the middle, Bonds sees the exact same pitches that he did in 2004 when he very much had a bat. Only this time, he’s standing there until he walks, strikes out, or gets plunked.
In the real world, Bonds’ OBP of .609 was the highest of all time. In Bois’ world, Bonds finishes with an on-base percentage of .608. In 617 plate appearances, real Barry reached base in 376 of them. Batless Barry reached base in 375.
What? How? What?
Bois figured this out by analyzing every pitch Bonds saw in 2004. (This data is available via Retrosheet, which provides a detailed pitch-by-pitch log of over 100 years of games.) In each of Bonds’ plate appearances, Bois simulated the at bat as though Bonds didn’t have a bat. Pitches that didn’t require a bat—i.e., balls and called strikes—stayed the same. For every swing, which our bat-free Barry can’t take, Bois had to make a decision: Ball or strike? Bois found that 80.9percent of the pitches Bonds swung at are in the strike zone (I’m not aware of an official stat for this, so I’ll call it the swing strike percentage). For each of these pitches, Bois flipped a coin that landed on a strike 80.9 percent of the time, and landed on a ball the remaining 19.1 percent of the time.
This calculation alone, however, isn’t enough. If Bois only simulated the pitches Bonds saw, some at bats, like the 61 in which Bonds put the first pitch in play, end with no outcome. This leaves our disarmed Bonds in the box with a 0-1 count, waiting, like a batter standing in against Steve “The Human Rain Delay” Trachsel, for another pitch that’ll never come, aging into eternity. To solve this problem, Bois simulated another pitch, this time using the overall ratio of balls and strikes that pitchers threw Bonds to bias his coin toss. Of all the pitches Bonds saw, 41.3 percent were in the strike zone (this is an official stat, and it’s known as the zone percentage) and 58.7 percent were outside of it. For each plate appearance that ended without an outcome based on real pitches, Bois randomly created additional pitches, one at a time using these ratios, until Bonds walked or struck out looking.
Add it all up, at least using the random numbers Bois drew in his simulation, and you get a nearly identical season to Bonds’ record-setting 2004.
Which seems impossible. Intuitively, intellectually, emotionally—something is wrong. I cannot hear this answer. Things are falling apart; the center is not holding; anarchy is loosed upon the baseball world.
In my despair, a coworker posed an even more terrifying question: What if Bonds didn’t break baseball—but bats did?
Bonds in isolation is breathtaking: He could’ve had the greatest OBP of all time without ever taking a single swing. But maybe, in looking for Bonds’ greatness, Bois stumbled on something much more unsettling—that any batter can step to the plate, reposition their helmet, spit on their hands, adjust their gloves, tap their toes, waggle their bats, and then...just watch as pitchers nibble at the corners and eventually walk them into Cooperstown.
To figure this out, I first recreated Bois’ simulation, both to confirm I was correctly following his approach and to validate that his result holds up over multiple simulations (as some commenters pointed out, Bois appears to have drawn his random numbers once, and it’s possible his season was an outlier).
Across 100 simulated seasons, Bois’ conclusion holds up. Bonds’ OBP ranged between .569 and .637, with a median of .604.1
Bonds, however, was an anomaly. When I applied the same simulations to 2004’s other great hitters, their OBPs fell significantly. The ten league leaders saw their OBP drop by 50 to 150 points (though for Lance Berkman, OBP actually increased).
Two factors explain why Bonds’ OBP holds up so well. First, the real Bonds didn’t swing in nearly a third of his real at bats. While these at bats could’ve been walks or strikeouts, they overwhelmingly ended in walks, and especially so for Bonds. Even if every simulated at bat became a strikeout, Bonds’ OBP would be .308, nearly triple the minimum possible OBP for any other batter.
Still, this doesn’t completely explain why Bonds performs so well. In simulated plate appearances (i.e., those in which Bonds swung, and require us to simulate what would’ve happened if he hadn’t), Bonds’ OBP is .428. The rest of the league leaders average an OBP of .281 in these types of at bats.
This gap is mostly explained by how pitchers pitch Bonds: They throw him a lot of balls. In 2004, Bonds’ zone percentage—the percentage of pitches to Bonds that are in the strike zone—was only 41 percent, compared to just over 50 percent for other top hitters. (Importantly, this measures the percent of pitches in the strike zone, not the percent of pitches that are strikes. If a batter fouls off a pitch in the dirt, that pitch will be officially recorded as a strike. In zone percentage calculations, it’ll be a ball. Assuming the umpire isn’t Angel Hernande—I mean, is perfect—and doesn’t call a pitch in the strike zone a ball, the zone percentage will always be lower than the percentage of pitches that are strikes.)
This gives our batless Bonds (and to a lesser extent, Lance Berkman and Todd Helton) a huge edge over other spectating hitters. In a completely artificial at bat in which we simulate every pitch, Bonds has a 51 percent chance of walking, while other top hitters only have a 34 percent chance.
All of this should give us some comfort. In 2004, Bonds put up comically preposterous, edge-of-reality, video game numbers. In that topsy turvy world, we get some topsy turvy results, like “Barry Bonds didn’t need a bat.” But everyone else did, so we can ignore that glitch in the Matrix and move on, right?
Right?
I thought so. But one dot kept nagging me.
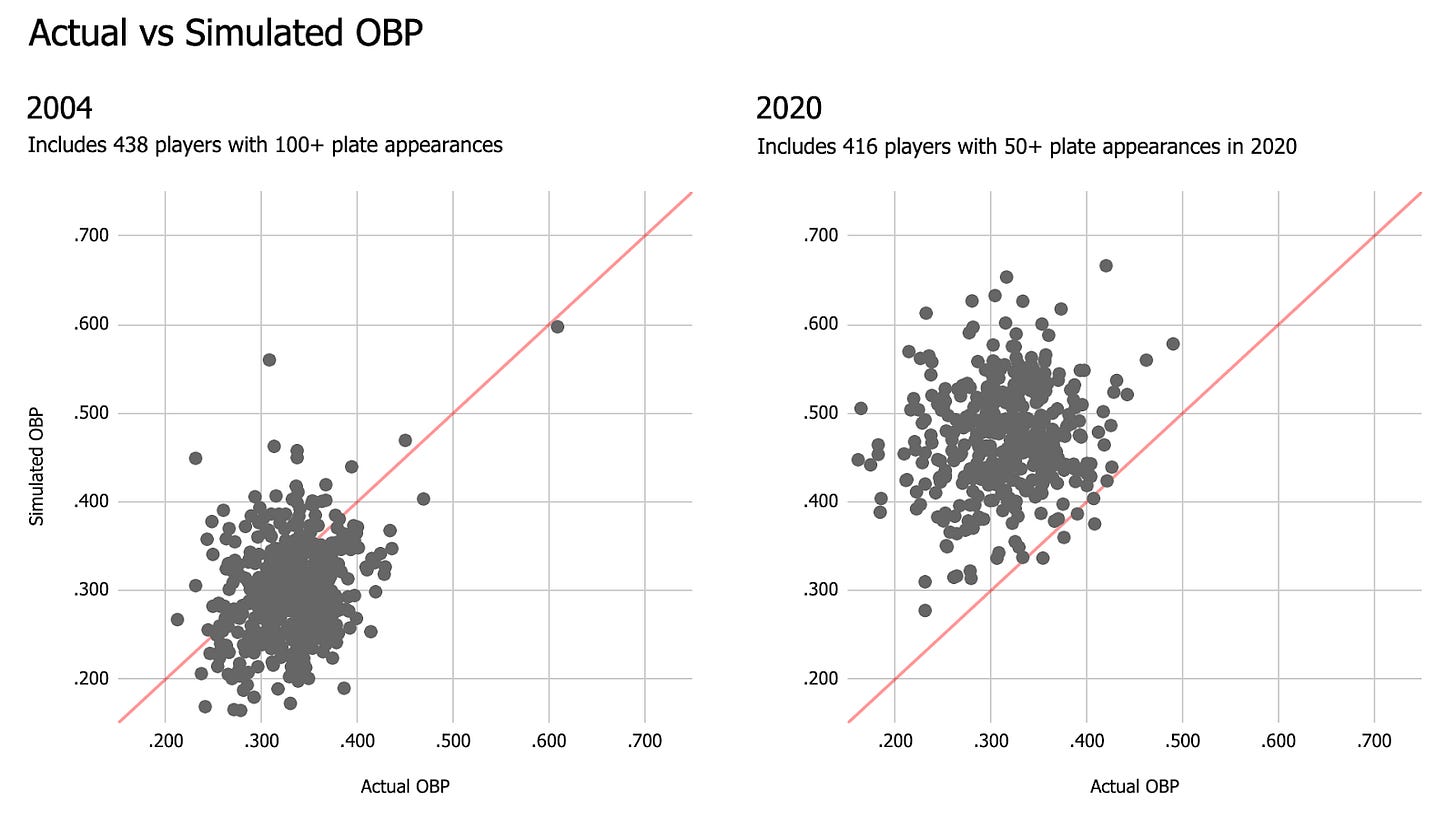
If great hitters get significantly worse when we take away their bats, why does the league as whole stay in the same place? By applying the same technique Bois applied to Bonds’ to every pitch sequence and every hitter in 2004, I found that the average OBP for the league falls by only 35 points, from .335 to .300.2
In other words, if we played the entire 2004 season without bats, the total number of baserunners would fall by about 10 percent, or two to three baserunners a game. That’s...not much difference.
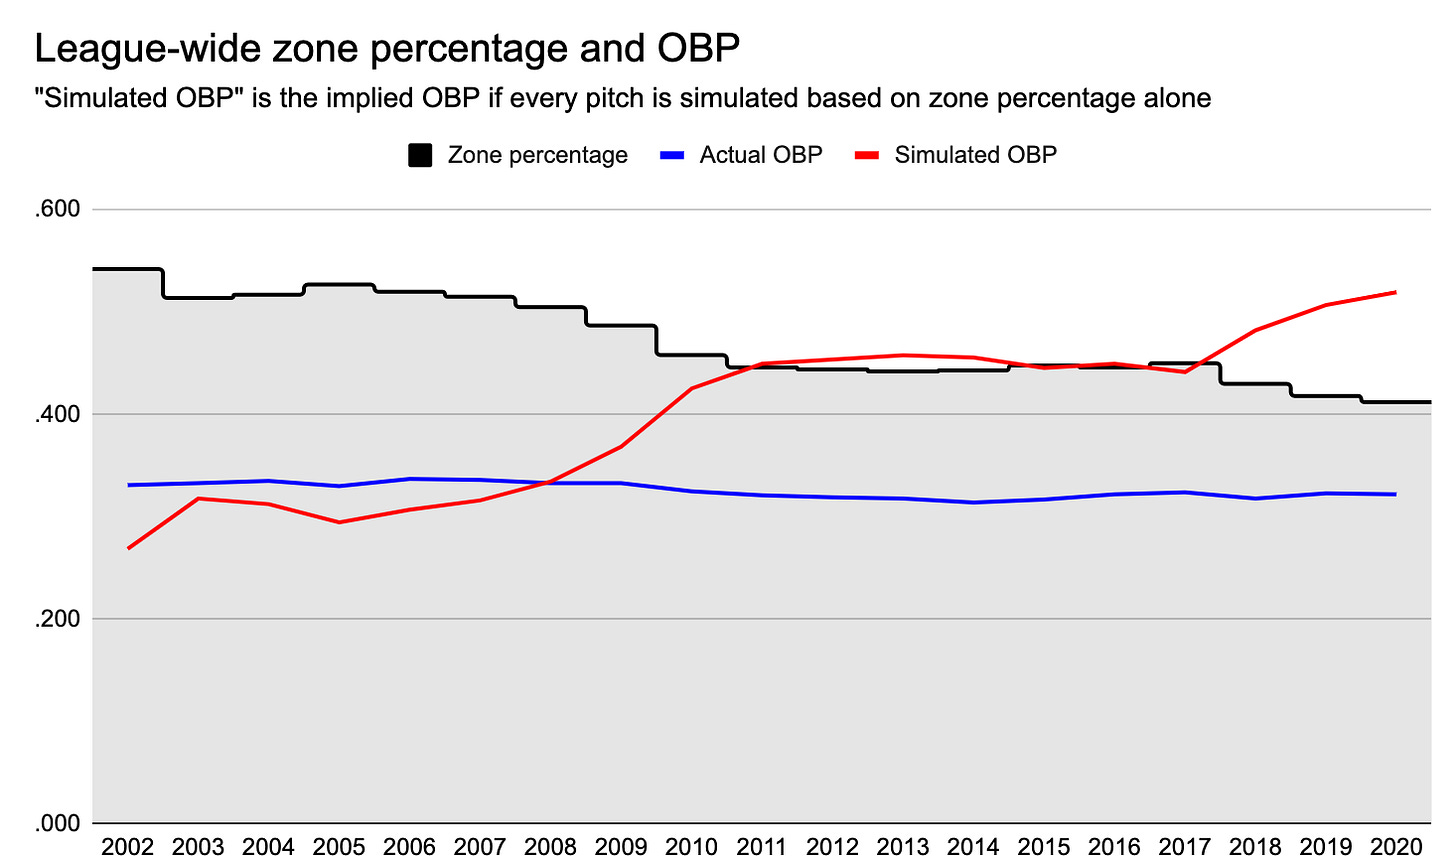
The reason is that the league-wide zone percentage was 51.7 percent. At this rate, batters who never swing would walk in 31.2 percent of their plate appearances, which is only slightly lower than the actual OBP they recorded with a bat. In 2004, bats helped, though not much.
But it gets weirder.
According to FanGraphs, zone percentages have been falling since steadily over the last two decades, reaching an all-time low of 41.2 percent in 2020. At that rate, a batter that does nothing but stand and watch would end up with an OBP of 0.519, 200 points higher than the actual league OPS of 0.322, 100 points higher than the league-wide slugging percentage of .418, and good enough for the tenth-best season of all time.
And it’s not only the average—in 2020, nearly every individual hitter would improve if they never swung. If we simulate every hitter’s 2020 season, as Bois did for Barry Bonds and as I did for 2004, the OBP increases for 411 out of 416 hitters with at least 50 plate appearances. In 2004, 73 percent of batters would record a lower OBP if you took away their bat. In 2020, fewer players—five—would see their OBP go down than the number—seven—who would break Bonds’ 2004 OBP record of .609.
Swinging, it turns out, not only makes the average hitter worse. Not swinging could make them a Hall of Famer.
Obviously, this isn’t strictly (or even remotely) true. A batter that never swings would see more strikes, and hits are generally better than walks. But the magnitude of the increase is overwhelming. Rather than learning to hit bad pitches, or trying to Bill Mazeroski, Kurt Gibson, Joe Carter, or even broken-bat-blooper Luis Gonzalez, we should learn to learn to take a few pitches. As yesterday’s opening day showed us, walks can be better than home runs.
If nothing else, the lesson is this: If your swing looks like mine—am I taking this pitch or swinging? Why is my bat so far behind my hands? And what on earth is happening with my front leg?—try doing less.
As a minor note, my swing strike percentage was slightly different from Bois’. Though FanGraphs doesn’t report this number directly, you can derive it from o-swing, z-swing, and swing percentages. I calculated Bonds’ 2004 swing strike percentage to be 78.8 percent, slightly lower than Bois’ value of 80.9 percent.
The league-wide simulations also use swing strike and zone percentages specific to each hitter (also from FanGraphs). In cases where data wasn’t available, I used the league average. On one hand, this makes this simulation slightly less reliable than Bonds’. On the other hand, the simulation is already assuming bats are mirages and pitchers have amnesia, so we’re not exactly winning any Fields Medals here.


