How to feel about a tie
What twelve years of NBA games tell us about when you should be confident during a close game, and when you should be worried.

There are questions every sports fan wants to know, but we never will. What if the Royals sent Alex Gordon? What if Tom Brady’s “tuck rule” pass had been (correctly) called a fumble? What if Chris Paul had been traded to the Lakers? What if JR Smith knew the score? What on God’s green earth was Will Craig thinking?
As a fan, there’s another question that always nagged me whenever I’m watching my team play: How stressed should I be during a tight game? In particular, given that a game is close, should I be more confident if my team has played well, or they’ve played poorly?
Nearly every narrative you can spin sounds plausible. Your inner optimist can make an easy case: “Yes, the game is tied, but we’re playing terribly; all we have to do is start playing like we normally do and we’ll be in great shape.” But a pessimist’s response is also reasonable: “We’re lucky to be hanging on after playing so badly; there’s no way we’ll be that lucky for the rest of the game; we’re as good as beat.”
This exact scenario happened a couple weeks ago in Game 7 between the Hawks and 76ers. The Hawks held a slight 2-point lead at halftime, but had played poorly. They only shot 39 percent, well below their regular season average of 47 percent. Trae Young played particularly badly, making only on of his twelve shots.
If you were a Hawks fan, how should you have felt? Should you be an optimist about turning it around in the second half, or a pessimist about your run of good luck coming to an end? Is momentum a more powerful force, or mean reversion?
Fortunately, unlike wondering what’s happening inside Will Craig’s head, these are questions we can answer.
Twelve years of ties
To figure this out, I collected data from Basketball-Reference.com on every NBA game from 2007-08 season through the 2018-19 season.1 In the 14,400 games played during that time (including both regular season and playoff games), the home team won 59.6 percent of the time. Home teams also, on average, led by 1.7 points at halftime.
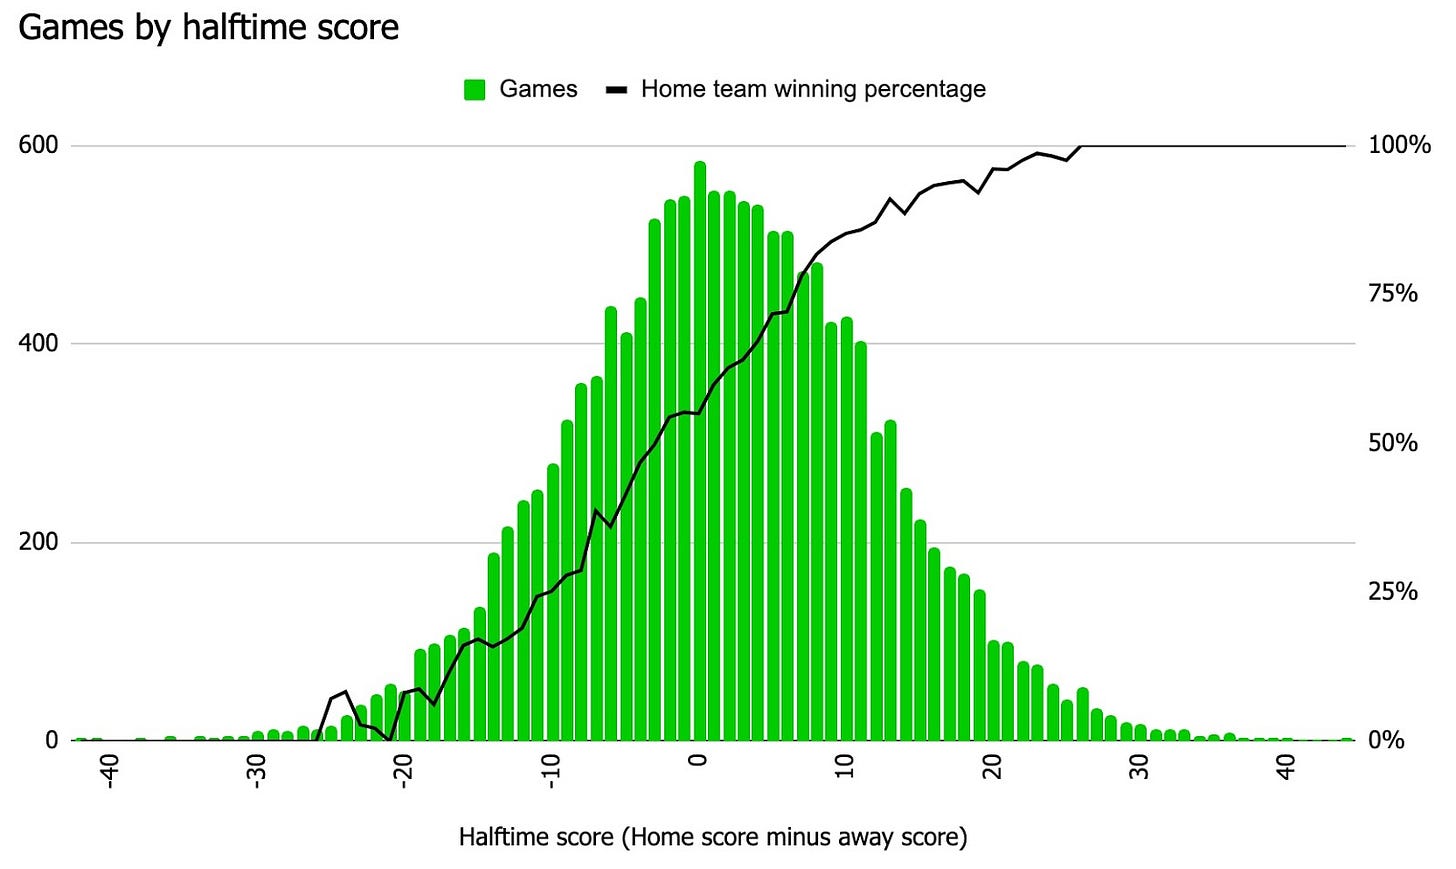
The chart below shows the distribution halftime scores across all of these games, and the winning percentages for the home team for each score. In tie games—the modal halftime outcome, it turns out2—home teams win 55 percent of the time. Unsurprisingly, the bigger the lead, the more likely teams are to win. And if the halftime deficit is 26 points, you can turn the game off. No team, home or away, has ever come back after being down by 26 or more points.
Eleven percent, or 1,681 games, were tied or one-point games at halftime. To me, these games qualify as “very close,” both numerically and emotionally. The question, then, is do winning percentages change given how a team plays in the first half?
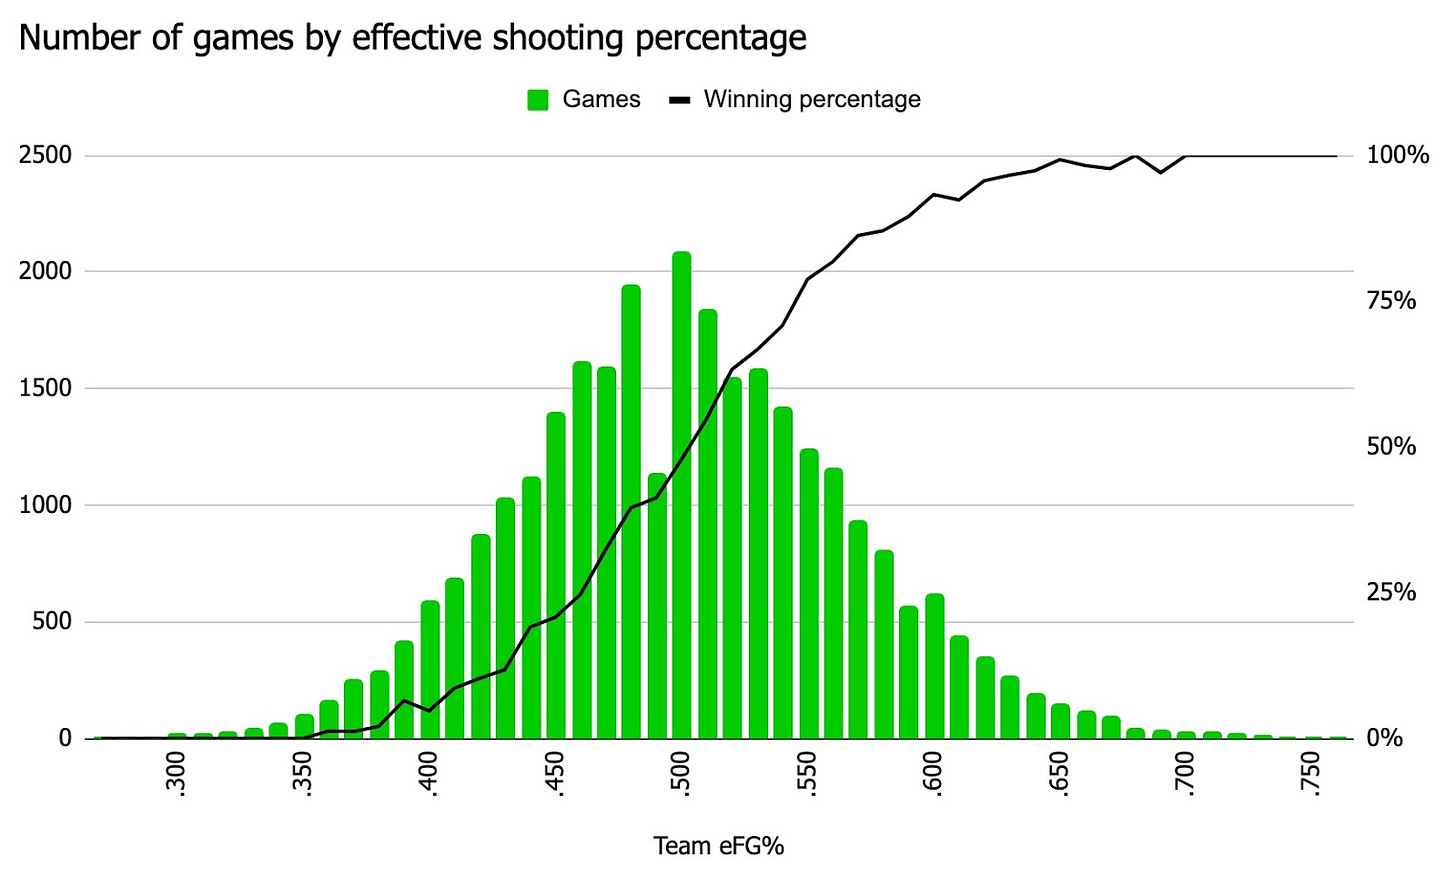
Before answering this question, we have to determine how to measure team performance. Though teams can play poorly in a lot of different ways, many of which don’t show up in a box score,3 shooting percentages are decent summaries of overall performance. Shooting percentages are both highly variable and well correlated with winning: The higher percentage a team shoots over the course of a game, the more likely they are to win. The chart below shows the distribution of shooting percentages by game, and the win probabilities for each.4
As a brief aside, field goal percentage can be measured in a number of ways, including standard field goal percentage, effective shooting percentage, and true shooting percentage. I use effective shooting percentage throughout, which makes adjustments to account for three pointers. That said, all the results here hold up across every flavor of shooting percentage.
Though league-wide shooting percentages are normally distributed around .500, what’s good or bad varies from team to team and season to season. This season, Brooklyn shot a league-leading effective shooting percentage of .575. Shooting .520 would be a bad game for Brooklyn, a good game for Orlando, and an average game for Brooklyn last year. If we want to assess a team’s first-half performance—and in particular, how that performance feels to us as stressed-out fans—the best measure is to compare their halftime shooting percentage to their season average.
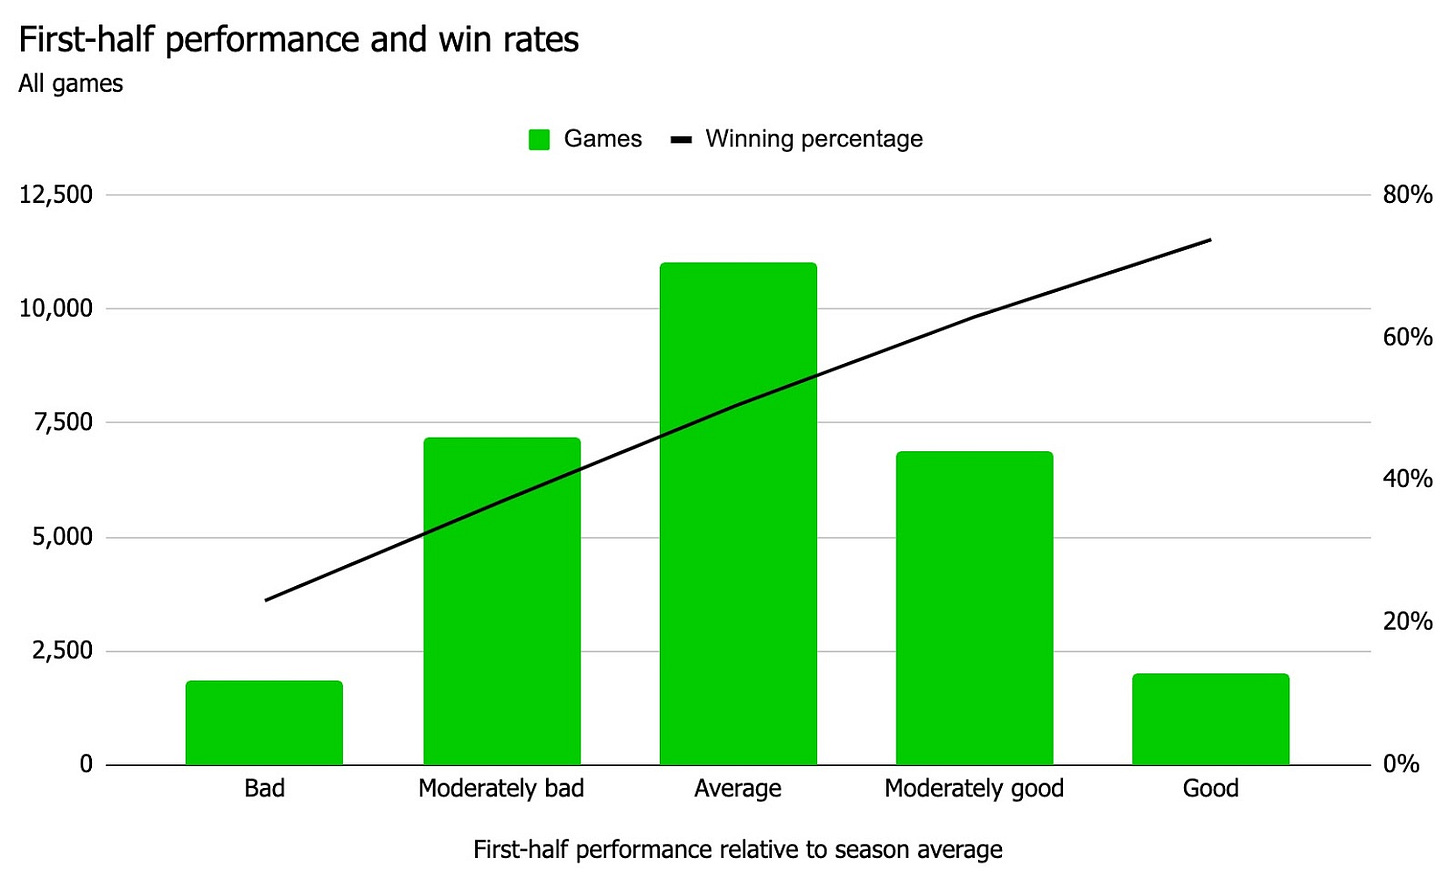
To do this, I found the average effective shooting percentage by season and team. I then measured how many standard deviations each first half’s shooting percentage was from that team's average first half that season.5 Each half could then be grouped into one of five categories:
Bad: More than 1.5 standard deviations below average.
Moderately bad: Between 1.5 and 0.5 standard deviations below average.
Average: Between 0.5 standard deviations below and 0.5 standard deviations above average.
Moderately good: Between 0.5 and 1.5 standard deviations above average.
Good: More than 1.5 standard deviations above average.
As the chart shows, first half performance is a decent predictor of the final outcome of the game. Teams that have a bad first half win 23 percent of the time, while those who have a good first half win 74 percent of the time.
But this graph includes all games, including when you’re up by 22. What happens if, despite a particularly good or bad performance, the game is tied?
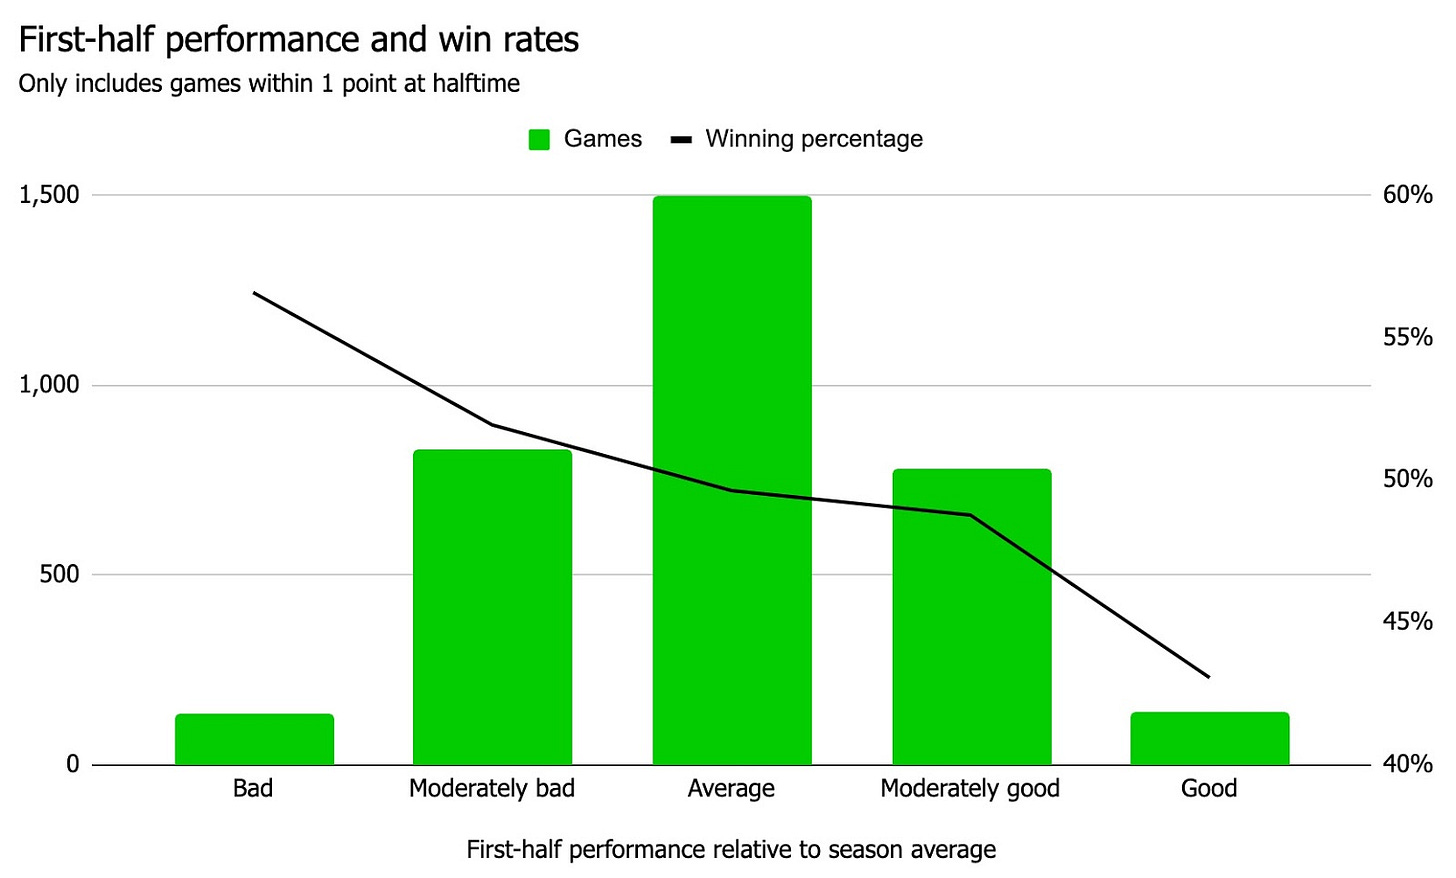
The result flips. For games in which the halftime score is within one point, the better you performed in the first half, the less likely you are to win. In close games, a poorly performing team wins 57 percent of the time; a well performing team wins only 43 percent of the time.
In other words, mean reversion overpowers momentum (if momentum exists at all).
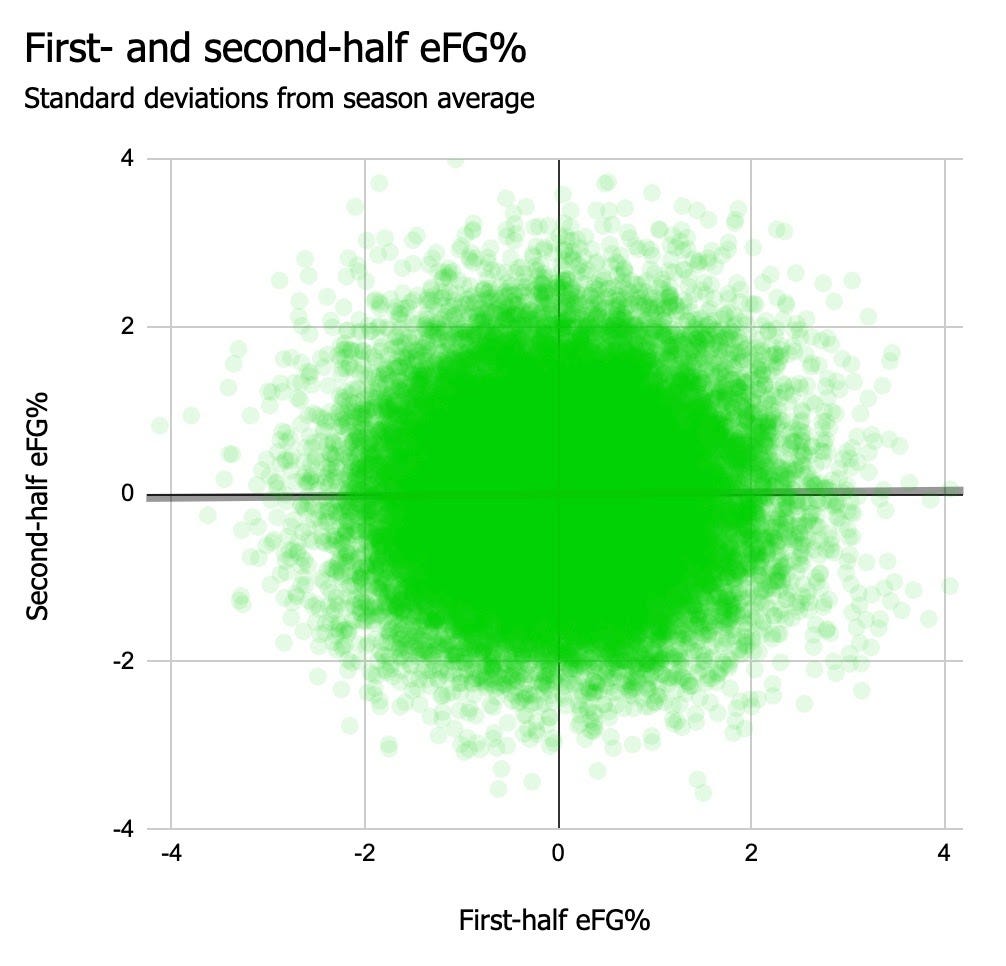
The scatterplot below shows why: There’s no relationship between first and second half performance. Teams that perform great in the first half are just as likely to perform badly in the second half as they are to perform great again. Or, conversely, if you had a bad first half, odds are your second half will be be better. And sure enough, in the Hawks-Sixers game last week, that’s exactly what happened. The Hawks came alive in the second half, and shot 50 percent—a number much closer to their seasons average of 47 percent—and won the game by 7.
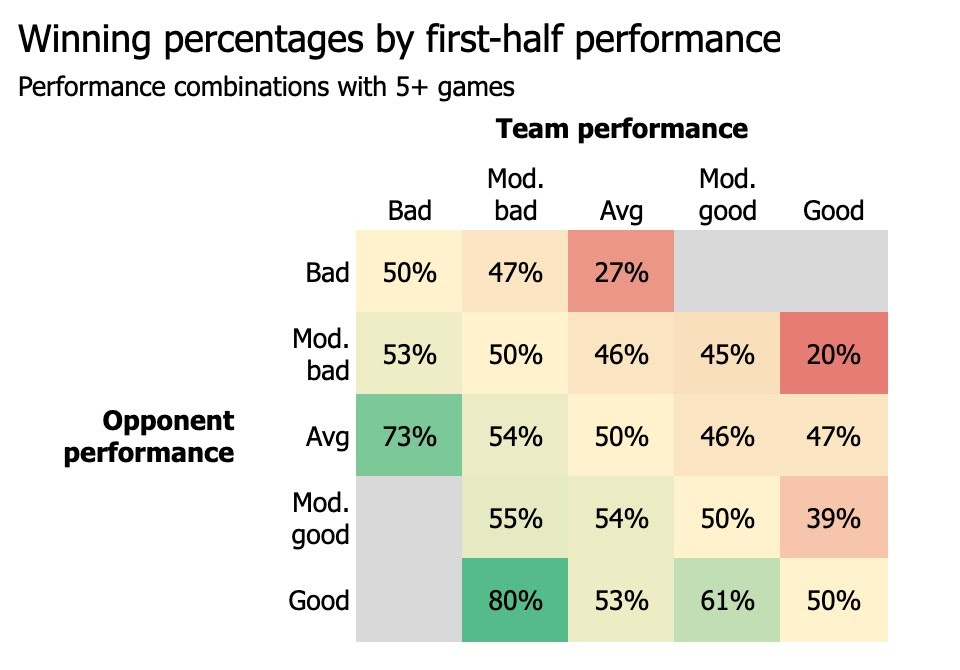
Mean reversion becomes powerful when one team performs abnormally poorly and one abnormally well. In most close games, if you perform poorly, chances are your opponent did too. But in rare cases, performances are mismatched. When this happens, the team that performed poorly wins roughy three out of four times.
The Citadel Scenario
In 2018, the undefeated Alabama football team played the 4-5 Citadel Bulldogs in Tuscaloosa. The game was supposed to be a laugher—Alabama was favored by 53 points.
At halftime, the game was tied.
After presumably watching Nick Saban’s head detonate in the locker room, Alabama steamrolled the Citadel in the second half, winning 50-17. While you can chalk this result up to mean reversion, it’s not exactly interesting. I’m sure plenty of Alabama fans were mad at half time, but I doubt many were particularly stressed.
Does this Citadel scenario explain our result? Is a team that plays badly in the first half of a tie game more likely to win because they were the better team, and more likely to win in the first place?
While there’s no perfect measure of how good a team is, Vegas is pretty good at estimating it. Using historic spread data, we can assess the perceived strength of each team prior to the game.
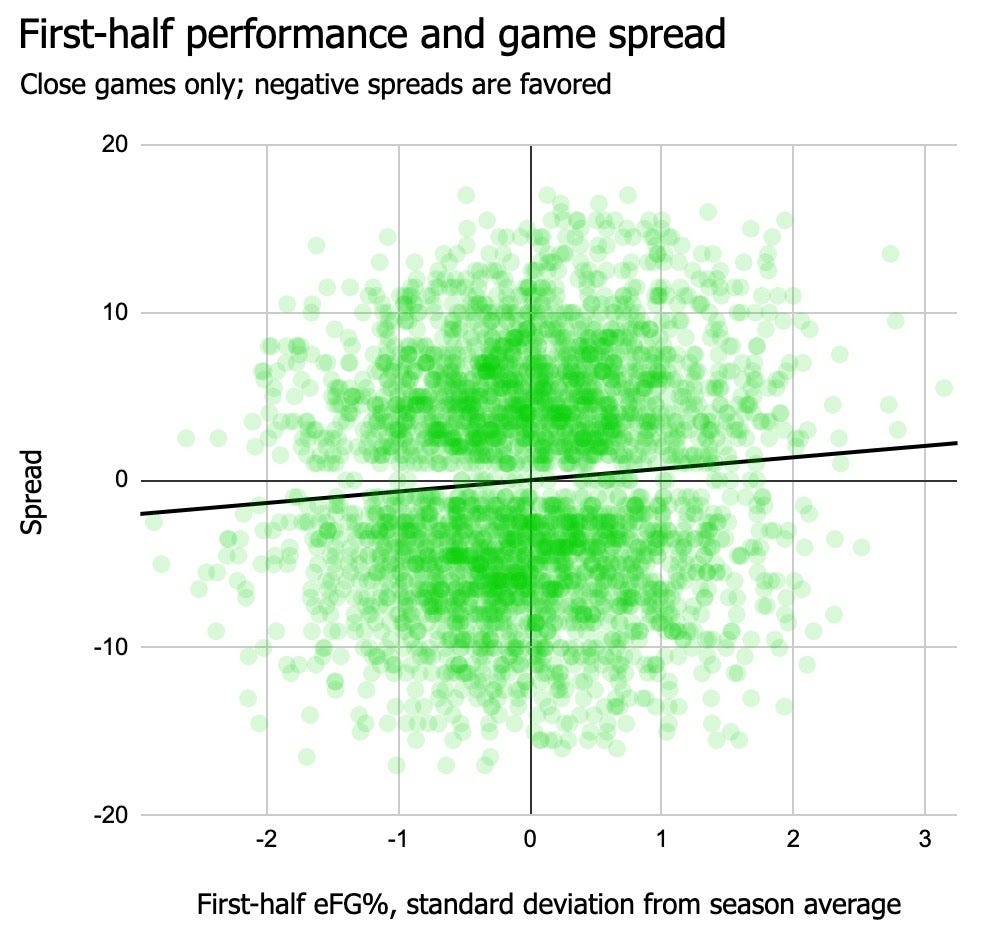
Over the last 12 years, there have been 129 NBA games in which the score at halftime was within a point and one team played badly relative to their season average. In those games, the poorly performing teams were, on average, 1.1 point favorites. In the 137 close games in which one team played well relative to their season average, the well-playing teams were 1.1 point underdogs. This suggests that the Citadel scenario happens, but it’s not the primary driver behind the prior result. As the following scatterplot shows, among the 3,400 close games in the dataset, there isn’t a strong correlation between first-half performance and the game’s spread.
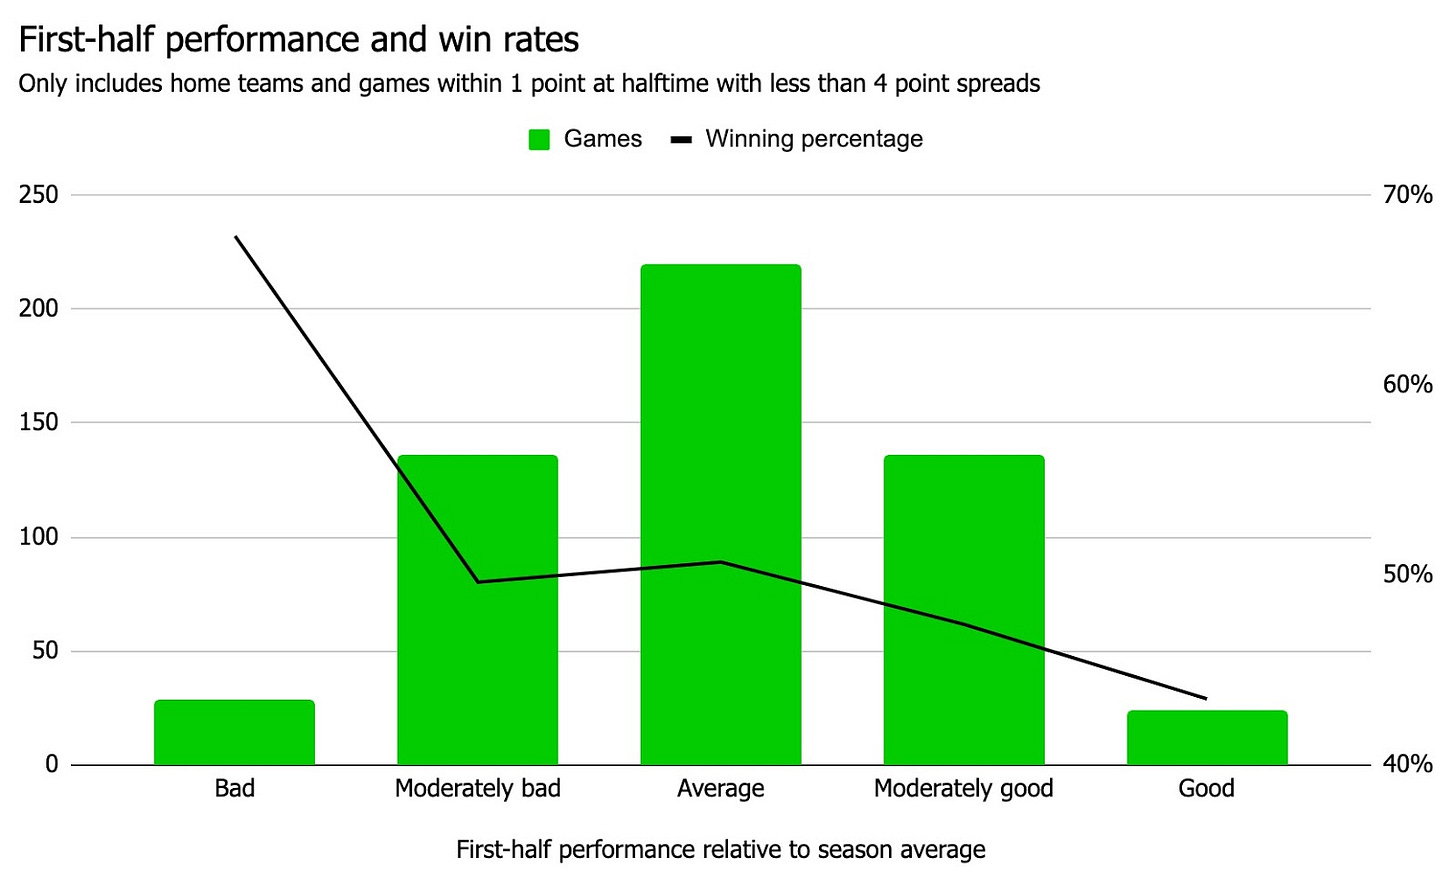
To confirm this, we can make one last comparison, controlling for as many factors as possible. The final chart below considers only games that meet a number of criteria: games within one point at halftime, with an initial spread of less than 4 points, and, to control for the effects of home-court advantage, only considering the results for home teams. Out of nearly 30,000 games, 540 qualify.
The conclusion is even stronger. Poor performing home teams win nearly 70 percent of the time, while well performing ones win just over 40 percent of these games.
This all points to a clear story: If your team is in a tight game, the worse they’ve played, the better you should feel. And while I didn’t look into it, I suspect this conclusion holds for other sports as well.
Except soccer, in which every half ends in a scoreless tie, followed by a second half of “magnificent chances”—An opportunity here! A shot!-Just wide!….but what a strike!—that also ends nil nil, followed by thirty exhausting minutes of pointless extra time that’s just the inevitable preamble to a ten-shot carnival game that determines the fate of millions of people’s mental health for nearly half a decade. If you’re wondering how to feel when you’re watching that, well, I can’t help you.
—
If you want to explore any of this data on your own, it’s available on Mode here.
I stopped before 2020 because 2020.
For those who are curious, the modal final score is the home team winning by 7 points.
Sadly, there is no “attention to detail” metric yet. If I were a real data scientist, I’d speech-to-text all of Charles Barkley’s halftime comments, apply some fancy sentiment analysis to them, and build an “turrible” index. But I am not a real data scientist.
The dip at .490 is a mathematical quirk: There aren’t many combinations of possible attempts and makes that round to .490. If you assume a team takes 100 or fewer shots in a game, there are 5,150 possible combinations of shot attempts and makes in game. There are about 50 combinations per shooting percentage integer (e.g., there are 52 ways to shoot 45 percent, or .450). There are only 26 ways to shoot .490, or 49 percent.
On average, teams shoot about one percentage point better in the first half than the second half, so I compared each game’s first half performance to their average first half performance, rather than their average season performance.
